
I live along the Chesapeake Bay and I got to thinking (a dangerous thing, naturally)… what if I used my analytical skills and took our database of dockominium sales and combined them with the Maryland State Department of Assessment and Taxation’s data? Could I do some fancy number crunching? What patterns in dockominium values would I see for the Bay? Although the numbers might be different, I’d expect the patterns to be the same in other dockominium markets.
So, I wrote a custom query and looked at the results. Nope, that won’t do. Too many “outliers” or data points that skew the results. Hmmm…. how about parsing paired sales and looking at the patterns? Well, that was definitely the way to go. ‘Curious about the results? Let me give you a teaser… from 2000 to 2009, it was a wild ride!
Let’s start with Queen Anne’s County on the opposite side of the Bay Bridge from my hometown Annapolis. Here are the stats for annual appreciation rates:
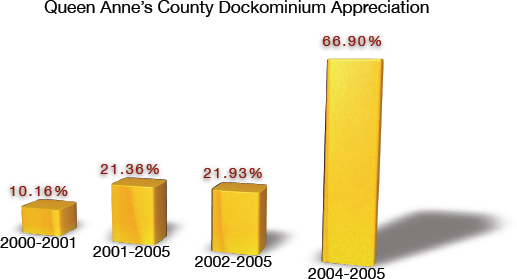
You’ll notice that I had to do some overlap in years based on the number of arm’s-length transactions shown for different periods. The above represent the largest numbers of paired sale transactions for a given period and they also tend to group themselves with fairly consistent appreciation rates. Outliers were minimized in these four groups and they were excluded. Note that the percentages shown were annual not in total.
2000-2005 Summary
It’s pretty obvious to see that the dockominium market got hot. This was especially true from 2004 to 2005. You could say that 2005 and early 2006 were the peak of the market. It was hard to lose in this investment from 2000 through year-end 2005. This is the pattern we’d expect to see since all other forms of real estate went through the same type of rapid appreciation.
Why No 2006-2008 Chart?
No, I didn’t intend to leave you hanging. The reason why I don’t show 2006 through 2008 in the graphic above is there just were not enough paired sales to show accurate numbers. This is shown below.
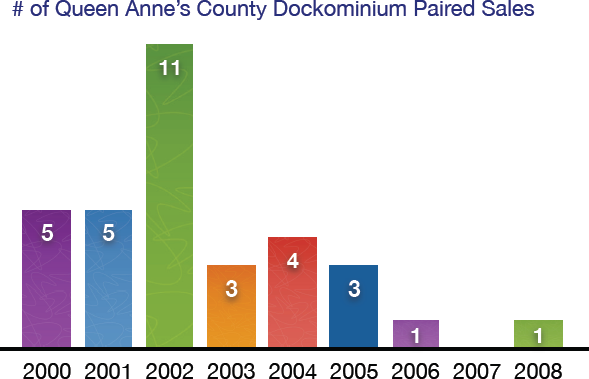
If you concluded that the number of sales dropped off starting in 2006, you’d be very right. Although what I report are paired sales, the same pattern holds for any sales – they just tanked. The same thing happened to dockominium financing as what happened to boats – down payments increased and credit scores did the same. For instance, if you want to buy a boat today, you’ll need to put 20 percent down, which is way more than just 5 percent or less during the early part of the decade. As for credit score, if you’re not over 700, forget about it. Just about any credit score could be placed prior to 2006.
The Diamond on Diamond Beach
There are some interesting relationships that show up from 2006 to 2008 that I can derive by looking at the few transactions that have occurred.
- The only 2007 sale, which was bought in 2006 and resold in 2007, had a 1.31 percent appreciation. Talk about anemic!
- The 2008 transaction above was resold in the same year – for a 38.81 percent loss. Ouch.
- Take a look at the appreciation from 2002 to 2005. There is one paired sale from 2003 that sold in early 2009. It had 14.76 percent annual appreciation. That may seem really good but consider what the appreciation rate was for 2003 to 2005 – it’s obvious that the return has been seriously diluted.
Bottom Line It For Me
So what we can conclude is the following:
- Dockos were hot up to some point in 2006.
- The floor fell out on them well before the “official” December 2008 start of the recession (which anyone in real estate knows began in late 2006).
- If you can’t finance them you can’t sell them. If you do, expect to sell it for a lot lower gain than when you bought it… if you bought it prior to 2006. If you bought it in 2006 or later, you can pretty well expect to sell it at a loss.
Some people may be down on dockominiums but that’s unfair. Every other property type out there shows the same pattern. Whether it be stocks, apartments, jewelry, antique automobiles or dockos, you have to catch the market at the right time. Buy low, sell high… or thanks to our magnificent lending institutions, you may not be able to sell at all!
In Part 2 I’ll do the same sort of analysis for dockos in Anne Arundel County, Maryland. In Part 3 I’ll put both counties together and draw conclusions for the Chesapeake Bay dockominium market as a whole.