
Not to be outdone, let’s try the same process that I did in Part 1 for Anne Arundel County, Maryland. Together, Queen Anne’s County and Anne Arundel County comprise almost all the dockominiums on the Chesapeake Bay, although Anne Arundel County has several times more dockominiums than Queen Anne’s.
So let’s see what happened with appreciation.
Looks like dockominiums were good investments in the beginning part of the decade and then they just caught on fire from 2003 to 2005. You couldn’t lose. However, look what happens from 2004 to 2006. The average yearly appreciation drops by about 25 percent from the 2004 to 2005 period, which means that returns took a big nose dive in 2006 to dilute it so much. With a couple of paired sales to draw from, 2007 was a year of depreciation so this further supports the fact that Anne Arundel County dockominiums felt the recession in 2006.
So let’s get a little more current. The graphic below shows how the volume of paired sales has the same relationship as the yearly appreciation/depreciation changes shown above.
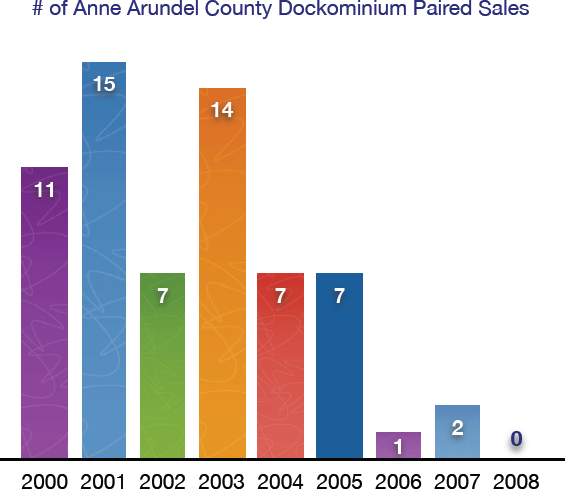
Yes, it was quite the nose dive here too. As you can guess, there just is not enough good paired sales data to show changes in dockominium values from 2008 to early 2009. Of course, there are other methods at my disposal to calculate those changes but that’s a far more labor intense process. With all the tax appeal and estate work I have in house, I will have to leave that to some other day. I have to work sometime, don’t I?
In Part 3 I’ll compare the two counties to get an overall picture of the Chesapeake Bay dockominium market.